Rotterdam City Council is in the vanguard when it comes to asset management. This is a step in the professional management of the outdoor space. Asset management ensures the optimum use of public resources and seeks the best balance between risks, performance, and costs. The City Council also considers the opportunities for the city.
The City Council wanted to have an overview of the availability of bridges, so that the management budget can be used in the most effective way. With Business Intelligence they were looking to answer two questions:
- What is the availability of all the bridges?
- What is the impact of regular and unplanned maintenance on road traffic and shipping?
The Power BI Dashboards
NB: All data that is shown in the screenshots below is fully anonymised and randomised. The figures bear no relation to the actual situation of Rotterdam City Council and only serve as an illustration.

Every delivery has an overview dashboard. This contains the most important KPIs (Key Performance Indicators). It ensures Rotterdam City Council always has insight into the number of open work tickets, the availability of the bridges, and the waiting times. Always (24/7) up to date and clear per year.
There is an underlying dashboard under each item.
Insight into the Availability
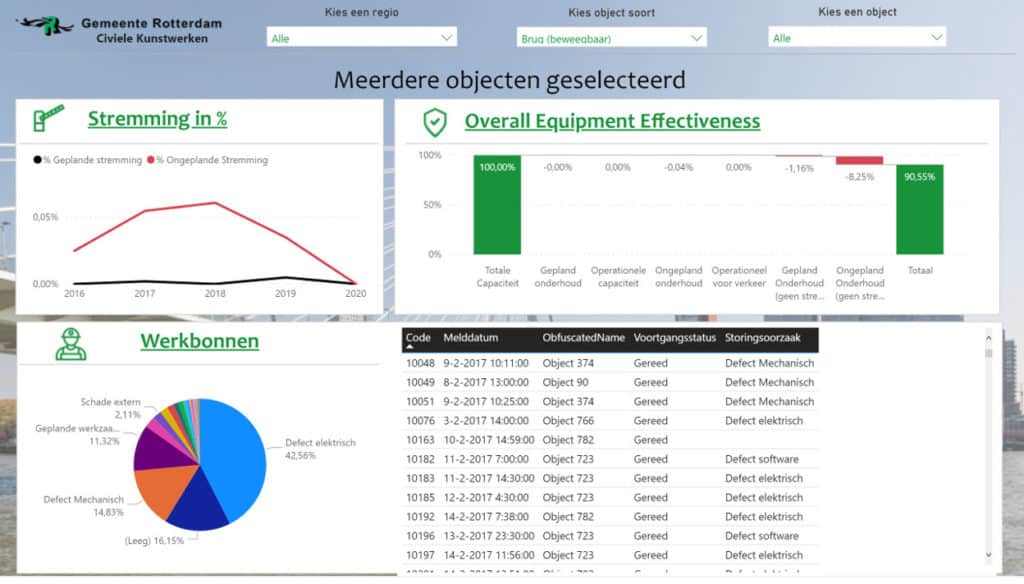
On the “Availability” page there is now clear insight into the availability of all the objects and for one or several objects over the years. As you can zoom in, it is possible to prepare an analysis of the reason for “unavailable”.
What are the biggest risks? Does this differ per type of object? Are there periods in the year when “unavailable” occurs more frequently? Etc. By showing the list of work tickets related to these figures, it is possible to answer these questions.
Insight into the Delivery times
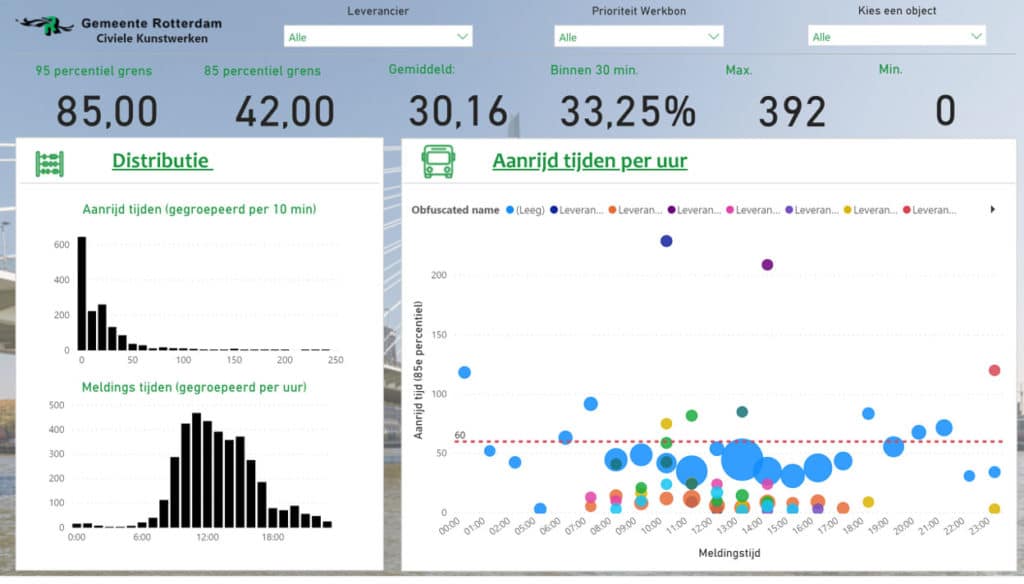
An object that is out of order can immediately produce a bottleneck in shipping or road traffic. This requires immediate action. The city has agreements on these issues with its suppliers. The agreement for delivery times is 60 minutes.
If the agreed waiting time is exceeded, the availability of the bridge decreases immediately. This report monitors whether the agreements are met and provides the option to zoom in on possible causes of exceeding the waiting times. Does the time of the issued report affect the waiting time? What are the differences between the suppliers?
Insight into the Lead times
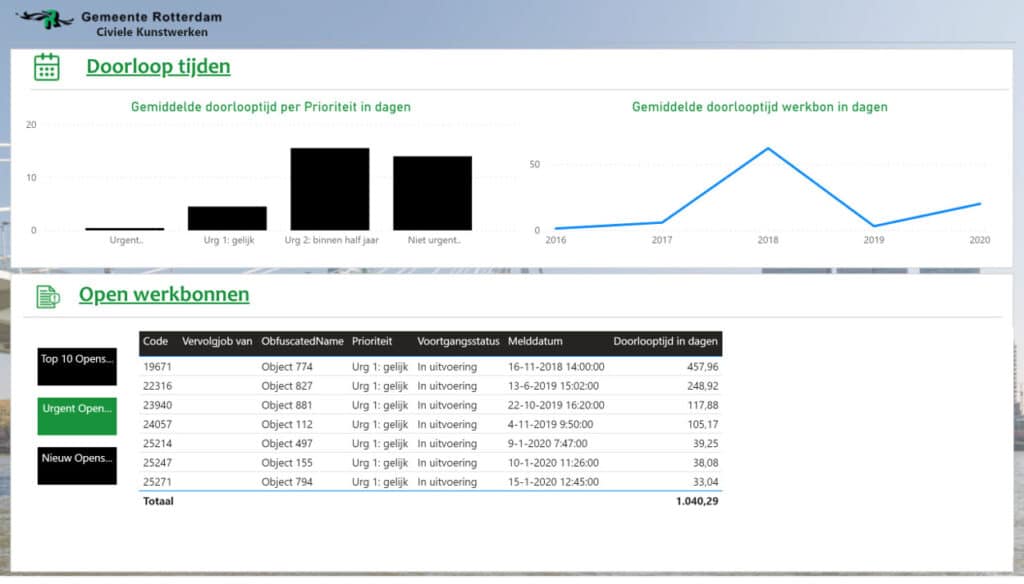
The second factor that affects the availability and the impact on road traffic and shipping is the time required for repairs and maintenance.
The dashboard provides insight into the completion times overall and per object. This produces answers to questions, such as: What is the average handling time for issued reports where a bottleneck is produced? How long does it take to complete less important maintenance? How long is the backlog of outstanding maintenance work?
Conclusion: Business Intelligence as part of assetmanagement
A first BI Discovery made it possible to create insight. It answers the two most important questions of the Rotterdam City Council. It also shows possible improvement points for the city’s recording process for civil-engineering structures. This was all included in the Business Intelligence Roadmap we prepared together with the City Council.