Your kidneys are vital, but anyone can end up with a kidney disease. The Dutch kidney foundation De Nierstichting works for kidney patients and healthy kidneys. They work on solutions that prevent damaged kidneys, such as eating less salt. They invest massively into research and innovation, such as a wearable artificial kidney. They fight for shorter waiting lists and more successful transplants and encourage research into cures for kidney diseases.
De Nierstichting does not receive any government subsidies. So, support from society is essential to the work of De Nierstichting. Insight into spending and confidence that donations are used effectively and efficiently are equally vital.
With Power BI, De Nierstichting aims to have data-driven substantiation for its spending, clear reports on results, and better measurement of the effectiveness of every euro spent.
From Excel and Exact to Power BI
Previously, the most important financial reports were a non-formatted table in Excel without options for making any other cross-sections or analyses. Producing reports required large amounts of manual work and the knowledge of the underpinning logic was no longer available. Producing the monthly reports on time was a massive challenge every time.
That’s all in the past.
All data that is shown in the screenshots below is fully anonymised and randomised. The figures bear no relation to the actual situation of De Nierstichting and only serve as an illustration.
KPI Dashboard of the financial performance
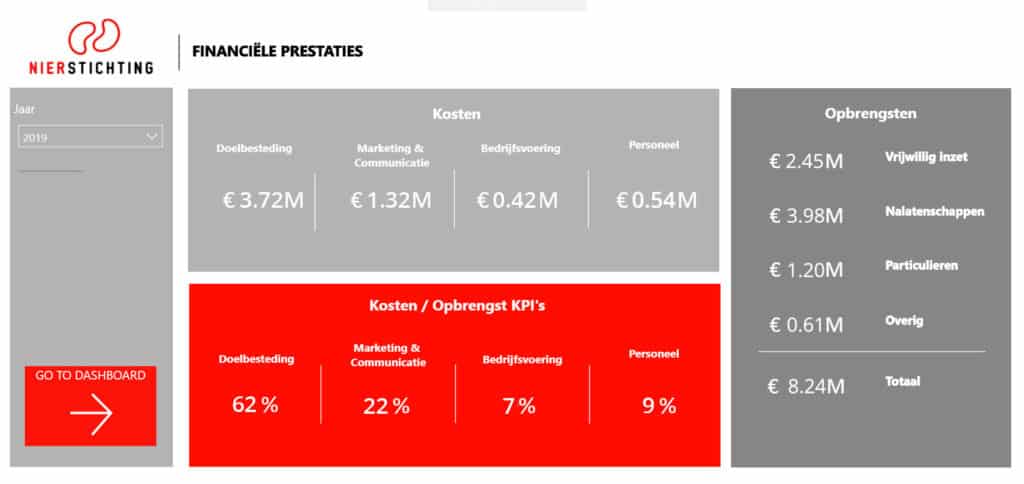
The dashboard contains a complete overview of the most important KPIs of De Nierstichting. They can always see the revenue, costs and the distribution of the revenue over the front line and their own business operations. The dashboard is real-time, or to put it another way: it is always up to date.
Providing insight into dynamic costs and revenue
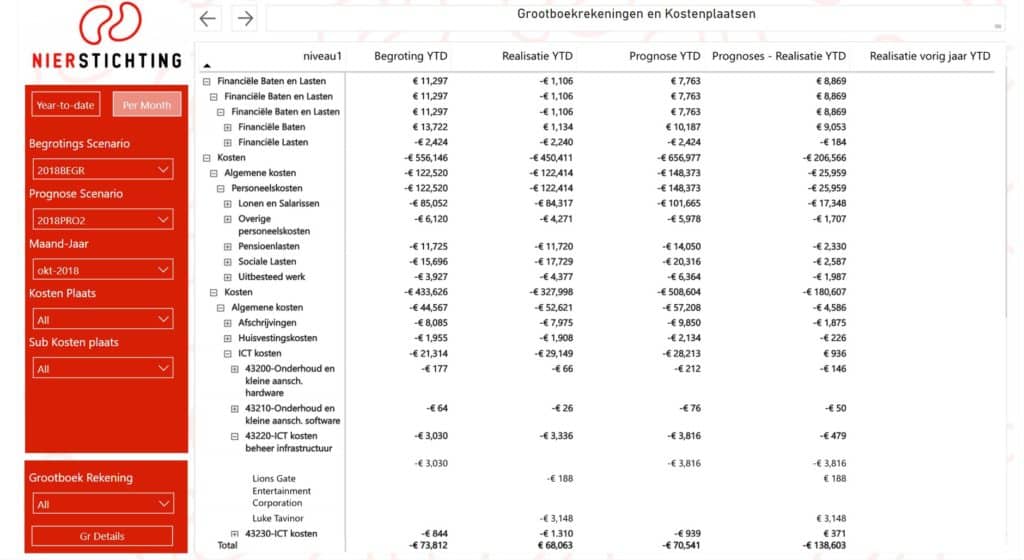
The old Excel report produced a static insight into the ledger movements at top level. At the request of De Nierstichting the layout did not change much, but the functionality did. The report has the option to produce cross-sections in various ways. One of the most important requirements was to see the underlying records that belong to the ledger account. Managers who are responsible for budgets want to be able to check the underlying records. That is now possible up to transaction level.
Insight into the revenues
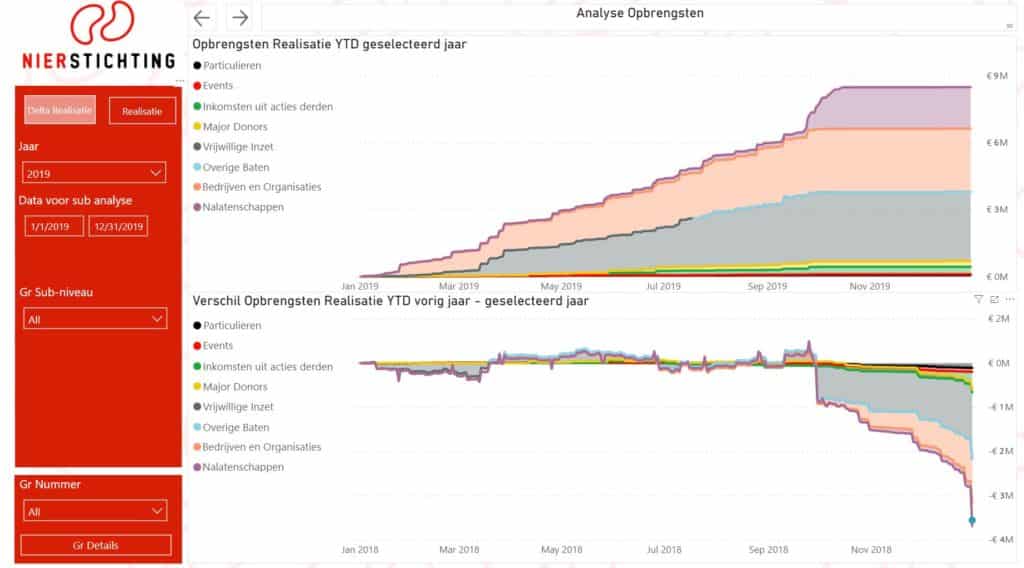
The turnover analysis dashboard is a deep-dive into the financial ledger accounts. This facilitates trend analyses over specific periods and possibly filtering on specific items. A comparison with previous years is also clearly visible. The impact of events, campaigns and other marketing actions can now be measured properly.
Insight into the ledger accounts
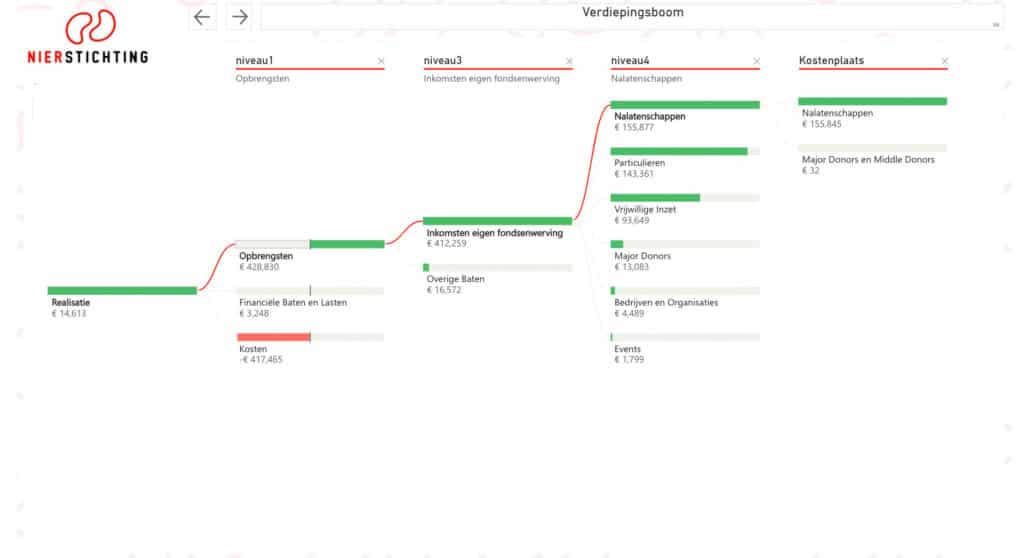
As the icing on the cake, we split the ledger account into the new treemap visual of Power BI. This treemap is really convenient if you want to see what costs and revenue are based on. This visual shows the structure of the ledger hierarchy. When you present information, the trick is often not to show too much. This visual only shows what you click on and that means that quantities and relationships register properly with the user.
At Nierstichting.nl you can read more about de Nierstichting and what you can do. Direct insight into the results is available in the annual report.