
Did you also start Power BI with great enthusiasm?
Chances are you will run into some questions. That is what this article is for! After all, with a "self-service BI tool," you have to manage it yourself.
Whether you're building a management, sales or marketing report, you always go through 6 of the same steps that form the foundation of every Power BI report. I'll take you through that step by step.
After this in-depth article, you'll understand exactly how Power BI works, what steps to take to build your Power BI report, and how to bring your data to life. They are also the steps we use during our Power BI consulting trajectories
Quick navigation
Step 1: Connecting your data sources
Step 3: Establish relationships between tables
Step 4: Visualize data and bring it to life
Step 5: Enriching data with calculations / DAX
Step 6: Share reports within the organization
Power BI Desktop vs Power BI Online
Before I fire the 6 steps at you, you must understand that Power BI consists of different parts and what the difference is. The two main components are Power BI Desktop and Power BI Online.
Power BI Desktop, as the name implies, resides locally on your Windows desktop (not available for Apple). This is the "full" version where you can model all your data and create, edit, and visualize your reports. Almost everyone who creates reports uses Power BI Desktop. When you're done with your report you publish your report to Power BI Online, where you can share it with colleagues and third parties.
Power BI Online, then, is online. In this version, you can share reports, as well as make adjustments (if you have been given the right to do so). These adjustments are visual adjustments with data already in place. You cannot model the data or create/build new data models. So you have to make do with the data you have. Perfect for when you do want to use just a different graphic or different colors. In principle, it is also possible to create very simple reports with a standard data set. The latter is material for another blog; I won't go into that further here.
Note: So in this blog, I am assuming you are using the Desktop version!
Build your reports in Power BI in 6 steps
To build your report always go through these 6 steps. Each step has its challenges and focal points, which I'll take you through in this blog. These are also the steps we go through in our online Power BI training for financials (secure link).
Power BI reporting Step 1: Connecting your data sources
This first step is very decisive for the next steps. When you get started with your Power BI reporting, you can link different types of data sources. Each data source has a different roadmap, depending on how your data is formatted.
Power BI has three types of data sources
- The first type of data source are data files. Think of an Excel, .csv or .xml file. Often they are exports from systems the company uses.
- The second type is based systems. Think of Google Analytics, Salesforce of Magento. Third-party software that does not reside locally on our computers but in the cloud.
- The third kind are databases that the enterprise manages itself, either on-premise or in the cloud.
The kind of data source you are going to link has a lot of influence on steps 2 + 3. Namely, modeling the data and establishing relationships between tables (building the data model). We discuss this in more detail in the following steps. We will now link our data source first.
If you're just getting started with Power BI, then starting with an Excel file link is easiest, such as the dataset you use for your current reports. The advantage is that you can now get started quickly to try out Power BI.
So for this example, I am linking an Excel file.
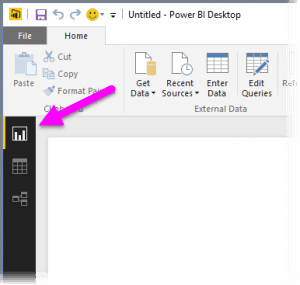
Step 1: In Power BI Desktop, click "Get data" at the top left.
Step 2: Select the type of resource you want to link. I choose Excel under the "Files" tab and click "Connect."
Step 3: I locate the Excel file on my computer, select the file, and press "Open."
Step 4: The "Navigator" view now opens. Now that I have selected the data source, Power BI wants to know which tables I want to use from that source. So in the case of Excel, Power BI wants to know what tabs (or data in a spreadsheet formatted as an actual table) I want to use. So select all the tabs you need for your Power BI reporting here. Once selected, you will see a preview of the data from the tabs. This is purely for overview, not editing.
Step 5: Here you have two options. The yellow "Load" button or the white "Edit" button. If you click Load, Power BI loads the data. If you click Edit, you will start modeling the data (Step 2 of this article). I recommend that you always click "Edit" because you often need to make a few minor adjustments, such as the name of the column headers. I'll go into that in more detail the next step.
Connecting data sources other than Excel
If you start linking other data sources directly, linking works a little differently. Are you starting with your own database that you manage yourself? Then you can "tap into" that directly with Power BI, provided you have access to the database. You then select "database" instead of "files" in step 2 (from the overview above).
If you want to start linking software packages, there must be a "connection" between Power BI and your software package. Microsoft calls that a "connector." Then select this in step 2.
If the connector for your cloud system does not exist, you have four options:
- The Power BI forum. Power BI has a very active community. So you can look up if someone else has a solution. You can also request that Microsoft develop the connector there. Because the community is so active, chances are that other users will support your request and/or think along with you.
- Excel export. Create an export to Excel and connect your Excel to Power BI. The downside is that an export to Excel is often limited and you still have to do manual work periodically.
- Third parties. You're really not the only one looking for a connector. In turn, other parties conveniently act in on that. They develop connectors that you in turn can buy or license. Here is an example: https://datavirtuality.com/connectors/.
- Developing yourself. For some organizations, it may be advantageous to develop their connector using Power BI's API. Developing a connector does require a developer with the associated costs. So you have to weigh those costs against the benefits. This is especially interesting for larger companies that do not want to depend on third parties.
Featured: connecting accounting packages to Power BI
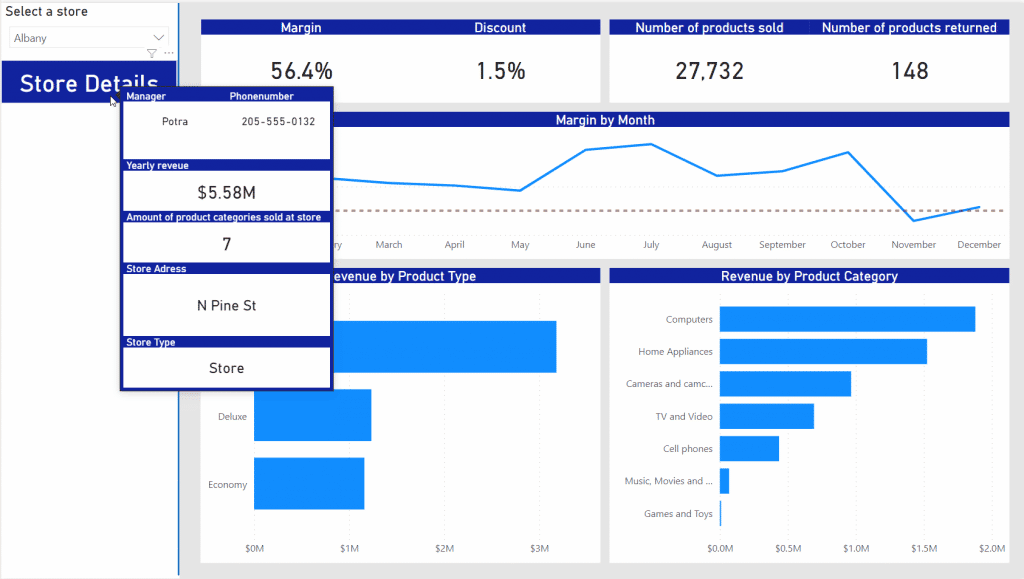
Some accounting packages have already developed a "connector," but many have not. Because Excel exports are usually too limited, we have developed our own solution for this that can connect to any accounting package imaginable and put the data into Power BI in a structured way. In doing so, we have already developed the necessary finance templates such as a revenue analysis, margin analysis, indirect costs, P&L, and balance sheet, in which the actual figures can be set off against (different) budget scenarios. Your data is live in a Power BI dashboard within 2 business days.
To give you an impression of the templates, we have put a "lite version" (it is not click-through) online. Check out the online Power BI demo here.
Power BI reporting step 2: Modeling your data
If you completed step 1 then your data source is now linked to Power BI. Depending on your data source (Excel, cloud software or database), the task now is to model your data. Power BI must be able to read your data, and for that, your data must be structured correctly. Modeling is what we call that. If you are working with a single Excel file, then it will be relatively simple. Here is a helpful YouTube tutorial on how to format the Excel file.
Modeling is done using the query editor
Data modeling takes place in the so-called Query Editor. This functionality is also in the most recent version of Excel. Edits you make here are stored in steps. You set this up once and as soon as the data refreshes these steps are performed again. This will save you a lot of time, which in turn can be used for analyzing the data.
This is a handy tutorial for modeling an Excel file in the Query editor: Click here for the youtube tutorial.
Modeling other data sources
So how much and what needs to be modeled depends entirely on your data source. Take Google Analytics as an example, a cloud system. The data is already set and requires virtually no modeling. You may still want to change labels of specific datasets to visualize them differently. But in principle everything is already in place for step 3. In step 3, you will still need to connect the different data sets. I explain this further in step 3.
A database, on the other hand, often needs more modifications, especially if it is an operational database. That is, it is the database where the program stores its data. This is usually set up to make the program work optimally and not for reporting purposes. It is recommended here that pre-standardized datasets be prepared in a separate database. I recommend that you get the IT department involved. You don't have one? Then consult an external party who can help you with it, as you want to make sure your dataset is prepared correctly before you start working with it.
Power BI reporting step 3: establishing relationships between tables
This is the last step before we start working with the visuals to really shape your Power BI reporting. Here we are going to establish relationships between the different datasets. This is what we call building the data model. Here, as in step 2, how much you apply this step depends on what data source you are connecting to as well as what data you want to visualize. For example, do you only use one Excel file with one tab? Then you can skip this step. Are you using an Excel file with multiple tabs, a database or a cloud system? Then read on.
To understand this step properly, you need to know how a database works. Because a database works differently than an Excel spreadsheet. Without going too deep into the technology, I'll show you the difference.
How excel works
In Excel you have all the data stored in a spreadsheet, all the info is in rows and columns one after the other. Suppose we look at the data per debtor, then you have different data per column, such as transaction data, debtor details, and products purchased. Then if you want to retrieve specific data to display, you do so from that spreadsheet. With a database, things work differently.
Here's how a database works
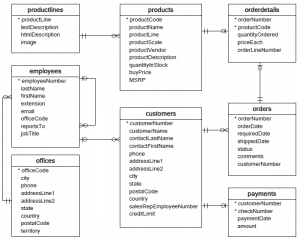
A database organizes all this data in a more efficient way (for the computer). Each type of data is in a separate table; for imaging purposes, you can compare that table to an Excel tab. So all the transaction data in one tab, the debtor details in another tab, and the products purchased again in another tab. This makes it possible to store large amounts of data without creating giant spreadsheets. This also allows a software system to process large amounts of data much faster. All those tables in turn have one piece of data that matches, for example, a unique debtor number. This ensures that the database always knows which information from table A matches the info from, say, tables B and C. See the image below of an example database structure.
Establishing relationships between tables
If you link a database and you want to display a debtor's various data in Power BI, you will need to establish relationships between those various tables to link the data. Be sure to always select 1 unique piece of data in Table A to link with Tables B and C (one to many, for example, the unique debtor number). Linking multiple data to multiple data is not possible (many to many).
Online Power BI Training
Want to get serious about using Power BI?
Then take our online Power BI training. We dive deeper into the material, really take the time to go over everything and we also look at your unique situation. The biggest advantage is that during the 3 modules, you work intensively with the material. That's when you learn the fastest and it will stick better. This is how you become truly independent with Power BI. You can read more about the training at the bottom of this article or click here to go straight to our training page.
Power BI reporting step 4: Visualizing data and bringing it to life
This is where the fun begins. When you have completed steps 1 through 3 you are ready to build and shape your report. Power BI has lots of different visuals that you can use to transform your data into a story and to build your reports. But you can also just tabulate data, would you miss the old familiar Excel overview ;)
This is also the moment when everyone becomes truly aware of the endless possibilities. After all, you have suddenly become a designer and storyteller. Now what story will you tell with all that data and how will you shape that story? Your visuals are also interactive, you can click through and graph A can react to graph B.
We've already built quite a few reports ourselves in Power BI and I'm happy to share our key learning points with you.
Engage the organization and work iteratively on your Power BI reporting
When creating your report, start with the end user involve them in the project. By involving the end user (e.g., management), you have a better idea of their desired insights. That way you can be sure that the delivered Power BI report is also exactly what they want to see. By engaging them, you will also see that they are much more enthusiastic about Power BI reporting and will use it faster and more.
Work iteratively and avoid endless feedback and adjustments. You start with version 1.0 which contains the main thing without too much formatting. Has version 1.0 been approved and provided with feedback? Then move on to versions 1.1, 1.2, and 1.3 until you arrive at the desired result. You keep complementing and expanding, but always in a forward direction. You will never have to "start over" in the middle of your Power BI reporting.
"By working iteratively you keep it simple, the bells and whistles only come at the end if really needed. The power of good Power BI reporting is often in that simplicity."
Make use of the Timeline Slicer (date slider)
This has long been the most requested feature in the Power BI community. This is not surprising because there is no dashboard where we do not use it. With the Timeline Slicer, all data adapts, according to the selected period. Perfect for quickly comparing quarter 1 with quarter 2!
You can download the slicer here:https://appsource.microsoft.com/en-us/product/office/WA104380786?src=office&corrid=d4c8726b-b21c-4456-bddf-c5ac2b0fac96&omexanonuid=5cd5db0d-90f9-4083-a303-d7c88ec9e95a.
Power BI reporting step 5: Enriching data with calculations / DAX
What is DAX? What do you use DAX for? Why is it important?
DAX offers enough material to write a full blog series about. In this blog, we'll keep it simple and explain what you need to know and what you use it for. Want to know more about DAX? Send us an email!
What is DAX?
DAX is a collection of functions, operators, and constants that can be used in a formula or expression to calculate and return one or more values. In simple language: DAX is the programming language (query language) behind Power BI. DAX is the language with which Power BI makes its calculations and executes your "commands" (queries).
"In simple language: DAX is the programming language (query language) behind Power BI. DAX is the language that Power BI uses to make its calculations and execute your 'commands' (queries)."
What do you use DAX for?
DAX helps you create new information based on data already in your data model. The best way I can explain this to you is through an example. Suppose you want to see the difference between sales of Q1 2017 and Q1 2018. You have the data for both quarters. The only thing missing is the calculation that shows the difference. To make that calculation, you use DAX.
Should I start learning DAX now?
Yes, you probably should. It is possible to create simple reports without DAX, but practice shows that this is rare. On the bright side, Microsoft has already added many standard calculations to Power BI that are ready to use. Still, average reporting will always need DAX to surface the right insights.
Power BI reporting step 6: Sharing reports within the organization
The report is finished! Now it's time for the final step, which is to publish your report to the online environment and share it with your colleagues, management, or external customers. Note; to do this, you do need a Power BI pro license. Fortunately, you can get one for as little as €9.40 per user per month.
In our Power BI webinar, we'll show you how easy it is to share a report.

Want to see Power BI in action? You can download our full webinar for free at this link
Power BI's sharing functionalities make this tool truly ideal. You can share a report with a team or an individual. For example, Management has visibility into key KPIs, the Marketing department sees if campaigns are generating money, and Finance has visibility into financial figures. Everyone in the organization becomes accountable, sees the effect of their work, and can make quick and data-driven adjustments. Insight, and therefore knowledge, is power.
A final benefit (and certainly not insignificant) is that when an employee leaves the organization, perhaps to work for a competitor, he or she no longer has access to anything when his or her Microsoft account is deactivated. This prevents that employee from downloading old reports from the mailbox or forwarding them to private mail.
Power BI Training: learn faster and get started in a targeted way
In our experience, most of the time goes into figuring out how it works, what the possibilities are, and how to extract specific insights from all that data at your disposal. Once you have mastered the basics and know how to get started in a focused way, it goes very smoothly.
Learning Power BI simply requires time. Our training makes your learning curve steeper and shorter. By working intensively with the material for not one but two days, you will quickly master all the basics. With that foundation, you can start using Power BI independently.
You can find all the information and practical details (dates, price, location) on our website:
Online Power BI training for financials (also with opportunities for non-financials).